Liquidity Grabs vs. Real Breakouts: Reading the “Institutional Footprint” in 2026
We’ve all been there: You see a perfect resistance level, a strong bullish candle closes above it, you enter long… and 15 minutes later, the market reversed, took your stop loss, and then went in your direction.
In the 2026 market environment, “Textbook Breakouts” are the #1 trap for retail traders. Because algorithms know exactly where your stop losses are, they often “hunt” that liquidity before the real move happens.
 How to Spot the Difference
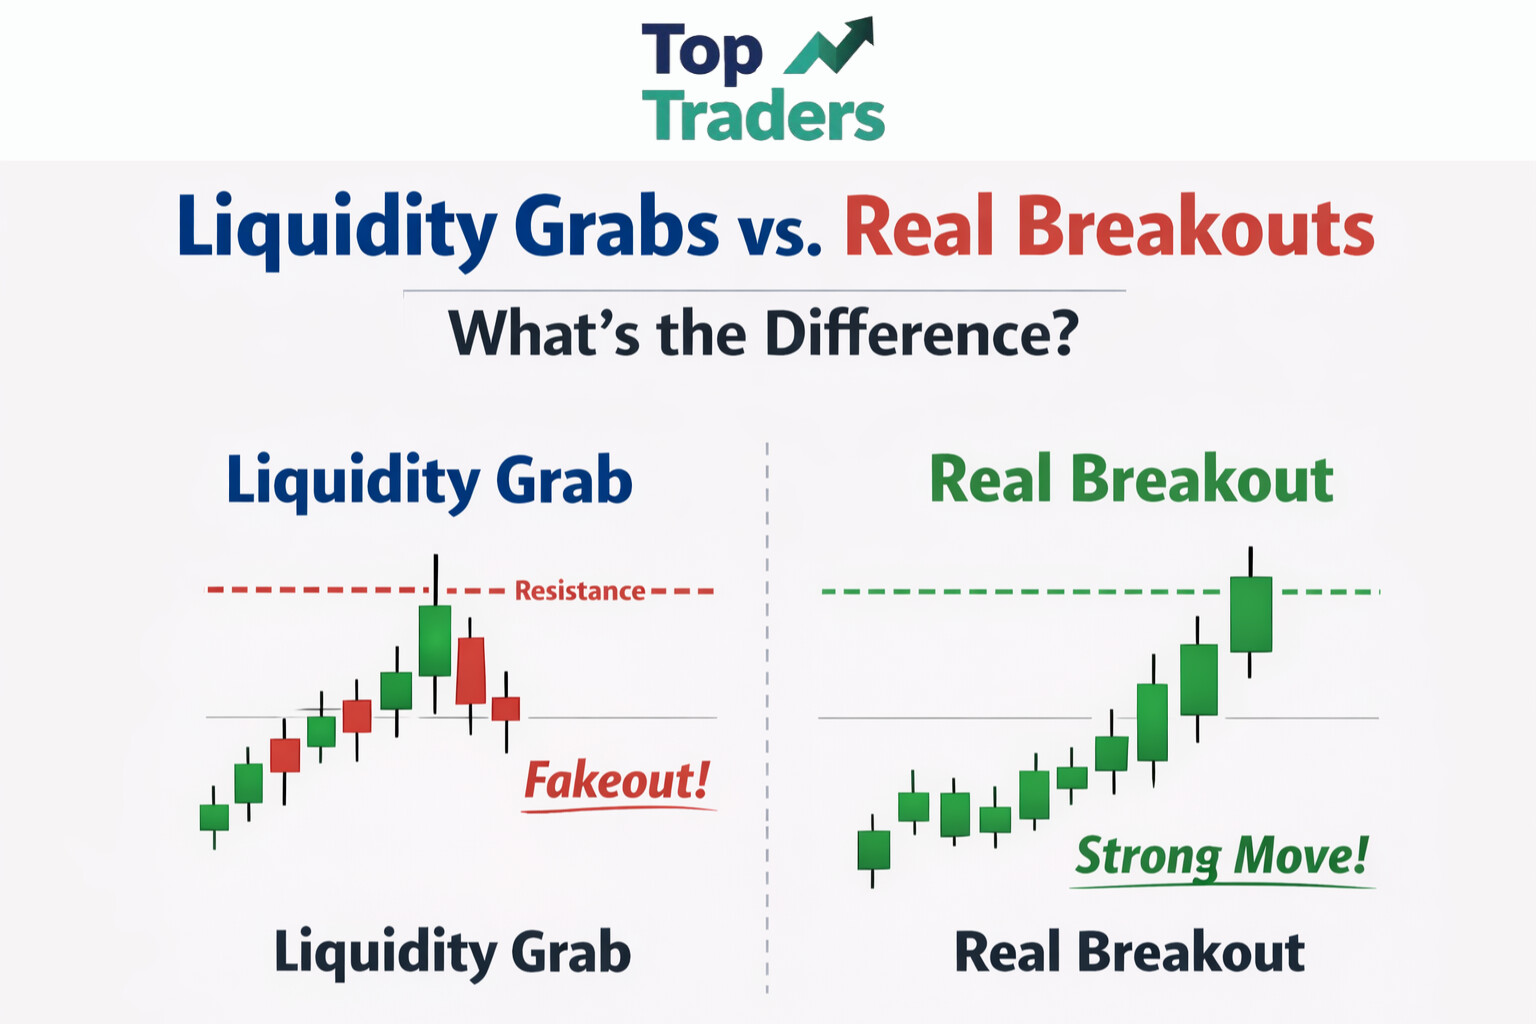
To survive this year’s volatility, we must distinguish between a Liquidity Grab and a Market Structure Break (MSB).
1. The “Wick” Evidence (The Liquidity Grab) If a candle pierces a key level but fails to close above it, leaving a long upper wick, that is a clear sign of a “Stop Run.” Institutions triggered your buy stops to fill their sell orders.
- The Rule: If there is no body closure above the level on the 1H or 4H timeframe, there is no breakout.
2. Displacement (The Real Breakout) A true Market Structure Break requires Displacement. This is characterized by large, full-bodied candles that move away from the level quickly, often leaving “Fair Value Gaps” (FVG) behind.
- The Signal: Look for a 3-candle sequence where the middle candle is significantly larger than the others.
3. Volume Confirmation In 2026, volume is our “Truth Meter.”
-
Fakeout: Low volume on the “breakout” candle usually indicates a lack of institutional backing.
-
Real Move: High relative volume on the breakout candle suggests that the “Big Money” is moving the price.
 Community Challenge: Show Us Your “Fakeouts”
Don’t be a “perfectionist” trader—be a “student” trader. Find a chart from this week where you got “trapped” by a liquidity hunt.
-
Post the screenshot.
-
Tell us: What was the one clue you missed that hinted it was a fakeout?
By analyzing our “trapped” trades together, we learn to see the market the way the algorithms do.