
 Best Timeframes for Intraday, Swing and Long-Term Traders
One of the first questions every trader asks is: “Which chart should I look at?”
The answer depends entirely on your trading personality. Choosing the wrong timeframe is like trying to sprint a marathon—you will burn out before you reach the finish line.
This guide breaks down the ideal timeframes for every style of trading, helping you match your charts to your lifestyle.
1. The Day Trader (Intraday) 

The Style: You open and close positions within the same day. You never hold trades overnight, avoiding “gap” risk. You thrive on action and quick decision-making.
The Best Timeframes:
-
Execution Chart (Entry): 5-Minute (M5) or 15-Minute (M15)
-
Trend Chart (Direction): 1-Hour (H1)
How to Trade It:
Use the 1-Hour chart to establish the overall trend for the morning (is the market bullish or bearish?). Once the direction is clear, drop down to the 5-Minute or 15-Minute chart to find your entry triggers (like breakouts or pullbacks).
-
 Pros: Instant feedback; no overnight stress.
 -
 Cons: Requires high screen time and intense focus; higher impact of spreads/commissions.
2. The Scalper (High-Frequency Intraday) 

The Style: A subset of day trading, but faster. You are looking to snatch small profits (5-10 pips) repeatedly throughout the session.
The Best Timeframes:
-
Execution Chart (Entry): 1-Minute (M1) or 3-Minute (M3)
-
Trend Chart (Direction): 15-Minute (M15)
How to Trade It:
Speed is everything. You are looking for momentary imbalances in supply and demand. You rely heavily on Level 2 data or pure price action on the 1-minute chart.
-
Pros: Potential for rapid account growth; opportunities in any market condition.
-
Cons: Extremely stressful; one bad trade can wipe out ten small wins; requires the lowest spread accounts (ECN).
3. The Swing Trader 
The Style: You hold trades for days or weeks. You aren’t interested in small intraday noise; you want to capture the “meat” of a market move. This is ideal for people with full-time jobs.
The Best Timeframes:
-
Execution Chart (Entry): 4-Hour (H4) or Daily (D1)
-
Trend Chart (Direction): Weekly (W1)
How to Trade It:
Check the Weekly chart on the weekend to identify key support/resistance levels. During the week, check the 4-Hour or Daily chart once every 4 hours or at the daily close (5 PM EST) to manage positions.
-
Pros: Low screen time (check charts 1-2 times a day); captures larger moves (hundreds of pips).
-
Cons: Exposure to overnight risk and weekend gaps; swap fees can accumulate.
4. The Position Trader (Long-Term Investor) 

The Style: You trade based on macroeconomics (Central Bank policies, GDP, employment). You hold trades for months or even years.
The Best Timeframes:
-
Execution Chart (Entry): Daily (D1) or Weekly (W1)
-
Trend Chart (Direction): Monthly (MN)
How to Trade It:
You are looking for major structural changes in the global economy. Short-term volatility is irrelevant. You might only take 5-10 trades per year.
-
Pros: Lowest stress; “Set and Forget” approach; tax efficient in some jurisdictions.
-
Cons: Requires massive patience; capital is tied up for long periods; requires deep fundamental knowledge.
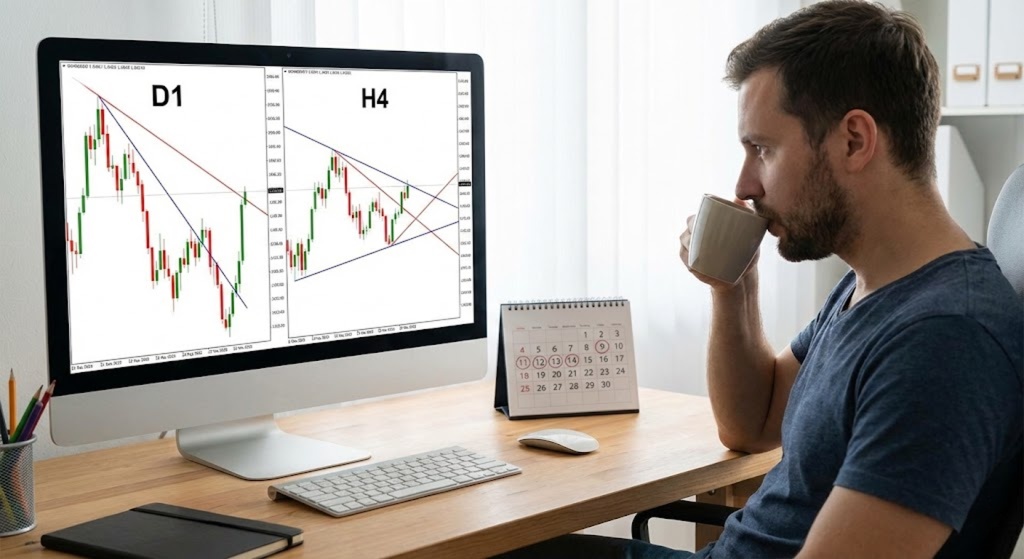
 The Golden Rule: Multi-Timeframe Analysis
The biggest secret to professional trading is never looking at just one timeframe.
Use the “Factor of 4 to 6” rule. If your trading timeframe is the 1-Hour chart, your trend chart should be roughly 4-6 times higher (the 4-Hour chart).
-
Top-Down Approach: Always start with the higher timeframe to see the “Big Picture.”
-
Zoom In: Use your lower timeframe only to time the entry.
-
Don’t Fight the Current: If the Weekly chart is uptrending, ignore sell signals on the 5-minute chart.
 Summary Table
| Trader Type | Primary Focus | Trend Chart | Entry Chart | Holding Time |
|---|---|---|---|---|
| Scalper | Quick Profits | M15 | M1 / M3 | Minutes |
| Day Trader | Daily Income | H1 | M5 / M15 | Hours |
| Swing Trader | Catching Trends | Weekly | H4 / Daily | Days/Weeks |
| Position Trader | Fundamentals | Monthly | Weekly | Months/Years |